Decode a Network Packet Hex Dump
2025-07-20
Introduction
In this post, we will walk through each step of converting the raw hex dump of a captured network packet into meaningful human-readable data. By the end of this post, you will be able to analyze a network packet capture hex dump like the following to identify each part of the packet and extract useful information from it:
00 00 00 00 00 00 00 00 00 00 00 00 08 00 45 00
00 22 94 ef 40 00 40 11 a7 d9 7f 00 00 01 7f 00
00 01 ce 47 15 30 00 0e fe 21 68 65 6c 6c 6f 0a
Consequently, you will understand how popular network forensics tools such as Wireshark and tcpdump are able to display network traffic captured from the wire in a human-readable form.
Outline
- Setup a network listener
- Capture network packets
- Analyze captured packets
Prerequisites
I encourage you to follow along with me in this post and perform the following steps on your own machine for a deeper understanding. I will be using an Ubuntu 24.04 virtual machine. You can use any popular Linux distribution or Windows Subsystem for Linux (WSL).
Familiarity with Bash and TCP/IP networking concepts is a plus. If you are new to TCP/IP networking concepts, I recommend these two playlists:
Setup UDP Listener
Setting up a User Datagram Protocol (UDP) listener in Linux is very easy, as its just one command:
nc -nuvl 127.0.0.1 5424
Flags summary:
nDon’t perform DNS resolution.uUse UDP (instead of default TCP).vVerbose output.lListen for incoming connections.127.0.0.1Address to listen to.5424Port to listen to.
After executing the above command, you should see some output like this:
Bound on 127.0.0.1 5424
In a separate terminal session, you can confirm that the listener is working properly via this command:
ss -ntplu | grep 5424
Example output:
udp UNCONN 0 0 127.0.0.1:5424 0.0.0.0:* users:(("nc",pid=2472,fd=3))
Capture Network Packets
Now that the network listener is set up, we need to send some packets to it. Before doing that, we’ll use a network tool called tcpdump to capture the packets and save them to a file.
In a separate terminal session, execute the following command:
sudo tcpdump -i lo dst port 5424 -w capture.pcap
Command breakdown:
sudoElevated privileges are required to listen to the loopback (lo) network interface.-i loRecord packets sent to the loopback interface.dst port 5424Only record packets with a destination port of 5424.-w capture.pcapWrite captured packets to file in Packet Capture (PCAP) format.
After executing the above command, you should see some output like this:
tcpdump: listening on lo, link-type EN10MB (Ethernet), snapshot length 262144 bytes
Now it’s time to send some packets to the listener. In a new terminal session, execute the following command:
echo "hello" | nc -u 127.0.0.1 5424
- This command sends the string
helloto port 5424 on the loopback interface address (127.0.0.1).
After executing this command, press CTRL+C on your keyboard to kill the connection.
In your UDP listener output, you should see something like the following:
Connection received on 127.0.0.1 34378
hello
In the UDP listener terminal session, press CTRL+C to stop the listener process.
In the tcpdump terminal session, press CTRL+C to stop the capture. You should see an output like the following:
^C1 packet captured
│
2 packets received by filter
│
0 packets dropped by kernel
Confirm that the file was created by listing files in the current working directory:
ls
Example output:
capture.pcap
Confirm that the file is a PCAP file:
file capture.pcap
Example output:
capture.pcap: pcap capture file, microsecond ts (little-endian) - version 2.4 (Ethernet, capture length 262144)
Analyze Captured Packets
If you’ve followed along with this article, you should now have a file called capture.pcap. This file contains all the network packets that were sent to the UDP listener. This type of file is referred to as a “Packet Capture” or “PCAP” file.
From netresec.com:
A PCAP file is a container for packets captured on a computer network, such as a WiFi or Ethernet network. The term PCAP is short for Packet CAPture.
Execute the following command to display the contents of the PCAP capture file in canonical hexadecimal and ASCII format:
hexdump -C capture.pcap
Example output:
00000000  d4 c3 b2 a1 02 00 04 00  00 00 00 00 00 00 00 00  |................|
00000010  00 00 04 00 01 00 00 00  65 df 7f 68 15 20 05 00  |........e..h. ..|
00000020  30 00 00 00 30 00 00 00  00 00 00 00 00 00 00 00  |0...0...........|
00000030  00 00 00 00 08 00 45 00  00 22 94 ef 40 00 40 11  |......E.."..@.@.|
00000040  a7 d9 7f 00 00 01 7f 00  00 01 ce 47 15 30 00 0e  |...........G.0..|
00000050  fe 21 68 65 6c 6c 6f 0a                           |.!hello.|
00000058
Your output might be somewhat different but that’s okay. The output above can be referred to as a “hex dump”. The leftmost column is the byte offset, starting from the first byte of the file. You can use this column to keep track of where you are in the file. The middle column is the bytes of the file itself displayed in hexadecimal format. The rightmost column is the bytes displayed in ASCII. When you select a packet in Wireshark, it will display a hex dump like this near the bottom of the GUI.
In the rest of the article, we will go through each byte of this packet to identify the different parts of the packet and understand what each each byte means. We will essentially be doing manually what Wireshark does for us automatically (that is, reading and interpreting the bytes of a packet capture).
Execute this command to make the output a bit cleaner:
hexdump -e '16/1 "%02x " "\n"' capture.pcap
Example output:
d4 c3 b2 a1 02 00 04 00 00 00 00 00 00 00 00 00
00 00 04 00 01 00 00 00 65 df 7f 68 15 20 05 00
30 00 00 00 30 00 00 00 00 00 00 00 00 00 00 00
00 00 00 00 08 00 45 00 00 22 94 ef 40 00 40 11
a7 d9 7f 00 00 01 7f 00 00 01 ce 47 15 30 00 0e
fe 21 68 65 6c 6c 6f 0a
This is the same command as before, but it doesn’t include the byte-offset on the left and ASCII on the right.
Each hexadecimal number in the hex dump above represents a single byte of the file. There is a maximum of 16 bytes per line. At first glance, this may look intimidating, especially if it’s your first time examining a hex dump. Rest assured that after doing this process once, you will find that it’s actually quite simple.
Before we make sense of these bytes, let’s run this command again to understand a bit more about the packet capture file itself:
file capture.pcap
Example output:
capture.pcap: pcap capture file, microsecond ts (little-endian) - version 2.4 (Ethernet, capture length 262144)
You’ll notice the output reads, “pcap capture file”. PCAP is the file format used by the popular libpcap library to save captured network packets. The libpcap library is used by Wireshark and tcpdump to record network packets from the wire. You can even use this library in your own programs to capture network traffic.
Also note that the output above says (little-endian) which indicates the bytes are recorded in little endian byte order. PCAP files are recorded according to the endianness of the host machine that is writing the file.
- If you are unfamiliar with endianness, please see this video.
I can confirm the endianness of my host with this command:
lscpu | grep "Byte Order"
Output:
Byte Order: Little Endian
Moving on, we can reference this document to understand and explain the structure of a PCAP capture file itself.
File Header
Let’s start by reading section 3. General File Structure:
A capture file begins with a File Header, followed by zero or more Packet Records, one per packet.
According to the document, the file header is 24 bytes. Use dd to copy the first 24 bytes of the capture into another file called capture_file_header:
dd if=capture.pcap of=capture_file_header bs=1 count=24
Print the hex dump of this new file:
hexdump -e '16/1 "%02x " "\n"' capture_file_header
Example output:
d4 c3 b2 a1 02 00 04 00 00 00 00 00 00 00 00 00
00 00 04 00 01 00 00 00
This is the File Header of the PCAP file. I don’t want to spend any time explaining this part because I want this article to focus on interpreting the bytes which make up of the actual network packets. If you are curious what the bytes in the File Header mean, read this part of the document.
Packet Record
As the document states, following the File Header is the “Packet Record”:
A Packet Record is the standard container for storing the packets coming from the network. … The packet record field begins with a 16 byte header, followed by data from the network packet
Let’s copy the Packet Record header of the first packet into its own file. From an offset of 24 bytes (the length of the File Header), use dd to copy the next 16 bytes (the length of the Packet Record header) into its own file:
dd if=capture.pcap of=capture_packet_1_packet_record_header bs=1 skip=24 count=16 iflag=skip_bytes,count_bytes
Print the hex dump of the Packet Record header file:
hexdump -e '16/1 "%02x " "\n"' capture_packet_1_packet_record_header
Example output:
65 df 7f 68 15 20 05 00 30 00 00 00 30 00 00 00
- If you performed your own capture, then your output may not be exactly the same.
The hex dump above is the Packet Record header of the first packet recorded in the PCAP capture file. This header contains information about the captured packet including a timestamp, and its length. The Packet Record header is followed by data from the packet. In this case, the data is a UDP datagram.
According to the document, the first 8 bytes serve as a timestamp:
65 df 7f 68 15 20 05 00
The first 4 bytes is the number of seconds since the Unix epoch. The last 4 bytes are the milliseconds since that time.
We can convert the first 4 bytes to decimal by executing the following command:
hexdump -n 4 -e '"%02x\n"' capture_packet_1_packet_record_header | tac | { read hex; echo $((0x$hex)); }
Example output:
1753210725
Convert the last 4 bytes to decimal:
hexdump -s 4 -n 4 -e '"%02x\n"' capture_packet_1_packet_record_header | tac | { read hex; echo $((0x$hex)); }
Example output:
335893
Putting these outputs together we get 1753210725.335893. This is the number of seconds and milliseconds since the Unix epoch at which time this packet was recorded.
You can execute this command to check the current Unix epoch time:
date +%s
Removing the timestamp bytes from the Packet Header, here’s what is left:
30 00 00 00 30 00 00 00
The first 4 bytes here make up the “Captured Packet Length” field. This field will tell us the length of the captured network packet. In the hex dump above, these bytes are 30 00 00 00. We only need to worry about the non-zero byte here (30). 0x30 converted to decimal is 48. This means the total length of the first captured packet will be 48 bytes.
Moving on, the next 4 bytes after that (again, 30 00 00 00) is the “Original Packet Length”. It can be different if the packet has been truncated by the capture process. As you can see, it has the same value as the Captured Packet Length field. This indicates our tcpdump process did not truncate the captured packet.
Packet Data
We have just completed interpreting the bytes which makeup the Packet Record field of the first captured packet. The document states the Packet Record field is followed by data from the packet. We know from our previous step that the length of the first captured packet is 48 bytes.
Let’s use dd to copy the 48 bytes which makeup the packet data of the first captured packet into a separate file called captured_packet_1_packet_data. Remember that the File Header field is 24 bytes long, and the following Packet Record field is 16 bytes long. Therefore I will start at an offset of 40 bytes, and I will copy the following 48 bytes to its own file:
dd if=capture.pcap of=capture_packet_1_packet_data bs=1 skip=40 count=48 iflag=skip_bytes,count_bytes
Now we have saved the bytes of the network packet itself (in this case, a UDP datagram) to its own file capture_packet_1_packet_data. Before moving on, let’s quickly review what we’ve covered so far.
Here is the original hex dump we started with earlier:
00000000  d4 c3 b2 a1 02 00 04 00  00 00 00 00 00 00 00 00  |................|
00000010  00 00 04 00 01 00 00 00  65 df 7f 68 15 20 05 00  |........e..h. ..|
00000020  30 00 00 00 30 00 00 00  00 00 00 00 00 00 00 00  |0...0...........|
00000030  00 00 00 00 08 00 45 00  00 22 94 ef 40 00 40 11  |......E.."..@.@.|
00000040  a7 d9 7f 00 00 01 7f 00  00 01 ce 47 15 30 00 0e  |...........G.0..|
00000050  fe 21 68 65 6c 6c 6f 0a                           |.!hello.|
00000058
We have now successfully identified three different parts of the hex dump:
- File header
- Packet Record
- Packet Data
Here I have highlighted and labeled the different sections we’ve identified so far in the hex dump:
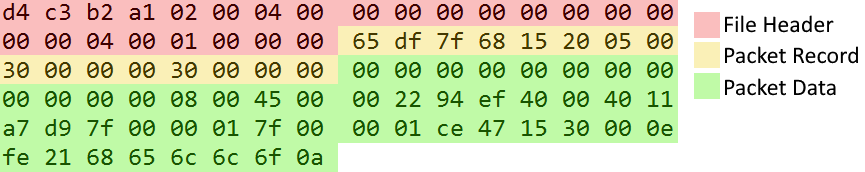
Now it’s time to inspect the Packet Data bytes. In this case, these bytes make up a User Datagram Protocol (UDP) datagram. I purposefully used UDP in this article for the sake of simplicity. UDP datagrams don’t contain as many fields as TCP packets (such as sequence number, flags, and window size to name a few), so it will be easier for us to interpret the bytes of a UDP capture.
Analyzing the Packet Data
If you’ve been following along thus far, you should now have a file named capture_packet_1_packet_data which contains the Packet Data section of the original PCAP file.
Let’s print the hex dump of this file:
hexdump -e '16/1 "%02x " "\n"' capture_packet_1_packet_data
Example output:
00 00 00 00 00 00 00 00 00 00 00 00 08 00 45 00
00 22 94 ef 40 00 40 11 a7 d9 7f 00 00 01 7f 00
00 01 ce 47 15 30 00 0e fe 21 68 65 6c 6c 6f 0a
Ethernet Frame
In TCP/IP networking, TCP and UDP packets are encapsulated within IP packets, which are then encapsulated within Ethernet frames, which are finally transmitted from one network interface to another until they reach their destination. The most common Ethernet frame format is the Ethernet Type II Frame:
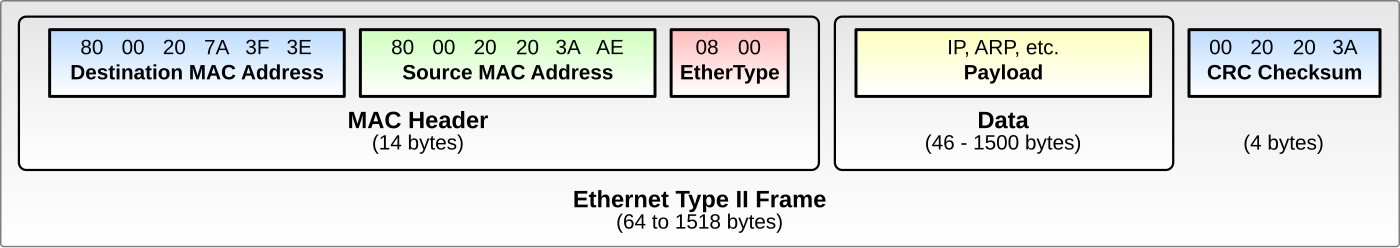
Referencing the diagram above, we can start to make sense of our hex dump. The diagram says the first 14 bytes of an Ethernet II frame makeup the Media Access Control (MAC) Header.
Here is the first 14 bytes of our hex dump:
00 00 00 00 00 00 00 00 00 00 00 00 08 00
The first 6 bytes (00 00 00 00 00 00) are the Destination MAC Address and the next 6 bytes (00 00 00 00 00 00) are the Source MAC Address. This means the source and destination MAC address for this Ethernet frame are both 00:00:00:00:00:00. Since we sent and recorded packets using the loopback interface, it makes sense that the MAC address values are all 0.
The final 2 bytes makeup the EtherType field, which is used to indicate to the receiver which protocol is encapsulated in the payload of the Ethernet frame. In our hex dump, the value of the EtherType field is 08 00, or 0x0800, which indicates the Ethernet frame contains an IPv4 packet. This is expected, since we initiated a UDP connection earlier, and UDP datagrams are encapsulated in Internet Protocol (IP) packets.
IPv4 Packet
Following the MAC Header is the Ethernet frame payload. Removing the MAC Header from the hex dump, here is what’s left:
45 00 00 22 94 ef 40 00 40 11 a7 d9 7f 00 00 01
7f 00 00 01 ce 47 15 30 00 0e fe 21 68 65 6c 6c
6f 0a
From this hex dump, we will extract the following information:
- Version
- Internet Header Length (IHL)
- DSCP
- ECN
- Total Length
- Identification
- Flags
- Fragment Offset
- Time To Live
- Protocol
- Header Checksum
- Source IP Address
- Destination IP Address
All these fields collectively make up an IPv4 packet header. I will reference this diagram to make sense of these bytes:
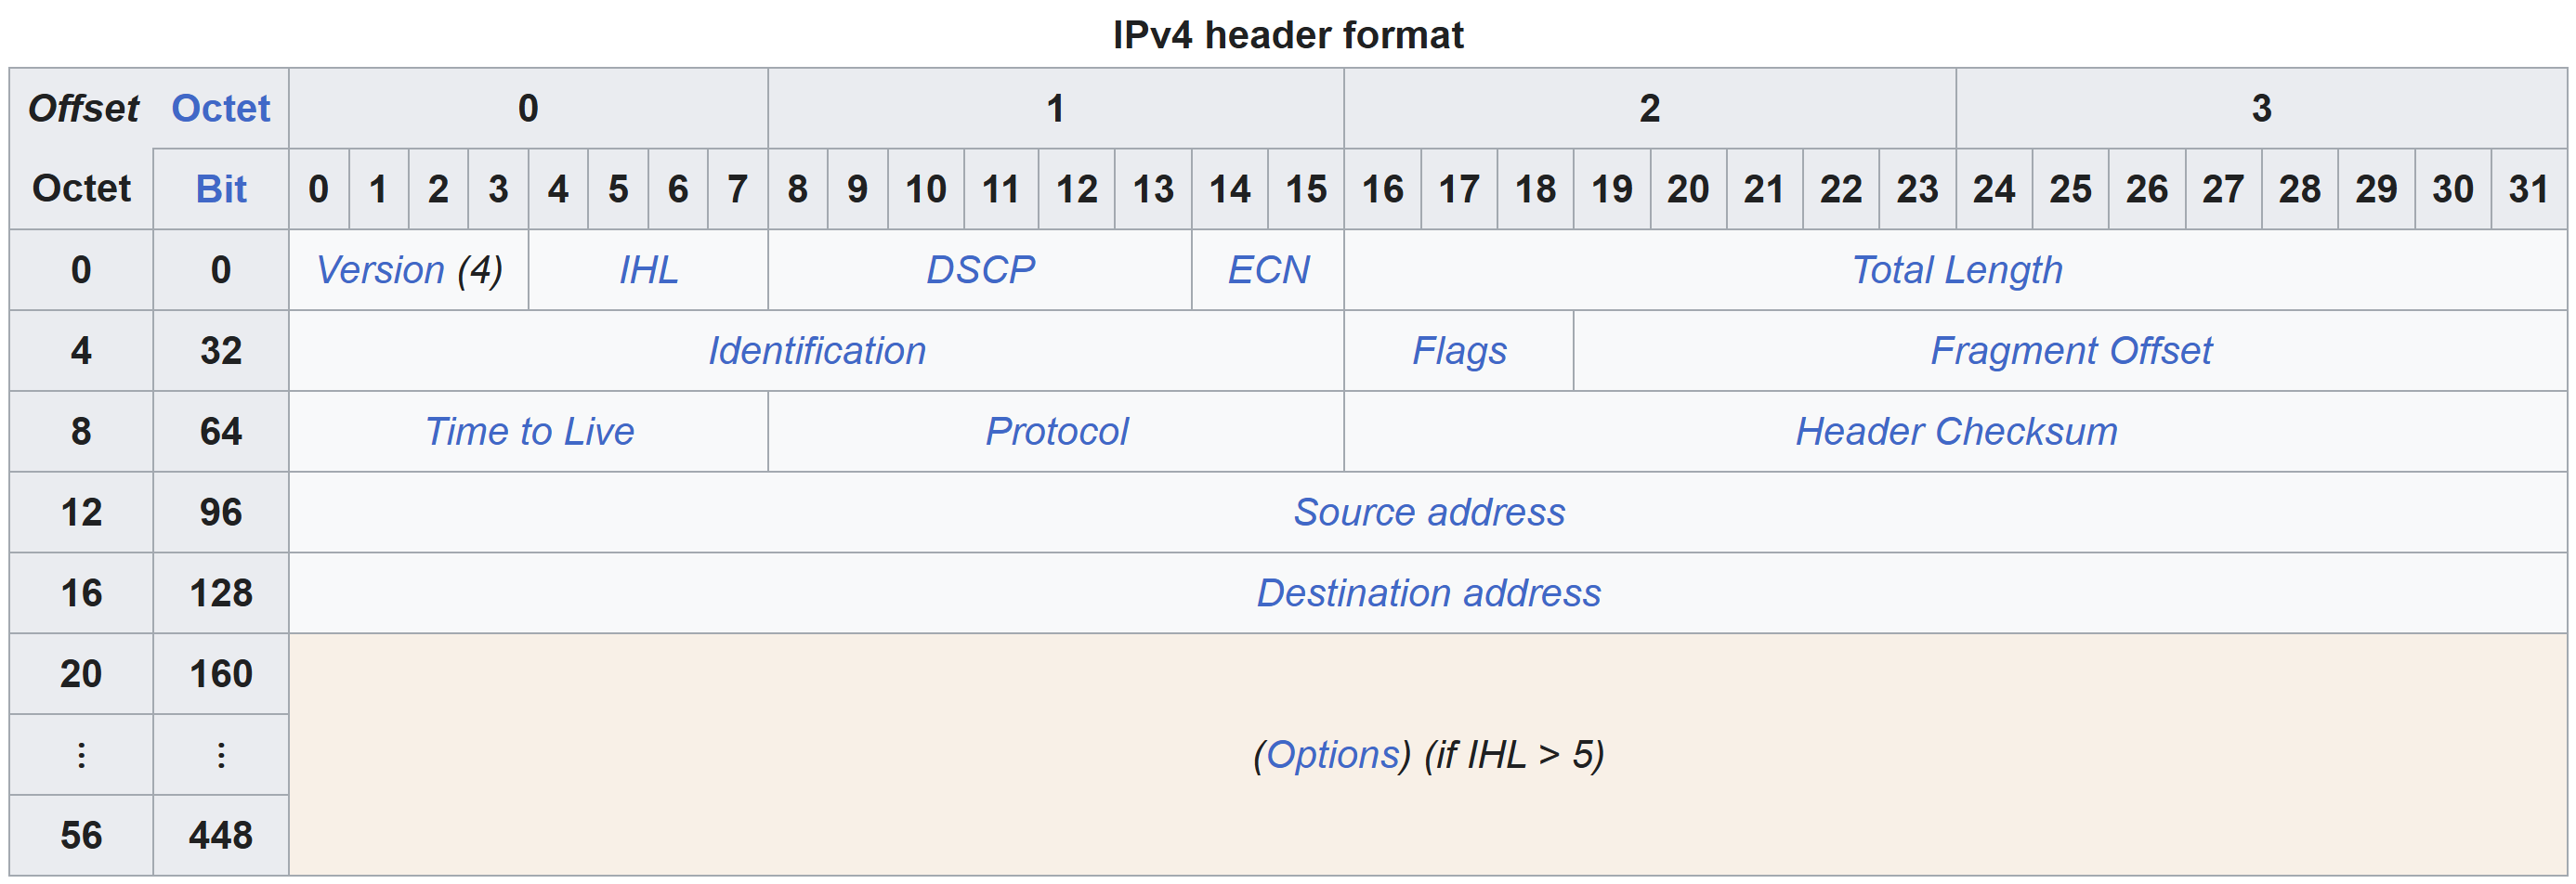
The diagram above indicates the 1st byte in the IPv4 packet contains the Version and Internet Header Length (IHL) fields. The 1st byte in our hex dump is 0x45. Because this byte contains the value of 2 fields of the IPv4 header, we first need to convert it to binary. 0x45 converted to binary is 01000101. The first 4 bits, 0100 is the value of the Version field, and the last 4 bits, 0101, is the value of the IHL field.
In decimal, the value of the version field is 4, and the value of the IHL field is 5. For IPv4 packets, the value of the version field is always 4. According to Wikipedia:
The IHL field contains the size of the IPv4 header; it has 4 bits that specify the number of 32-bit words in the header.
This means we can multiply the value of our IHL field by 32 to see how long the IPv4 header is:
- 5 * 32 = 160
From this equation we can understand that our IPv4 header is 160 bits, or 20 bytes long. With this information, we can identify which part of the hex dump is the IPv4 header, and which part is the IPv4 payload. Here is the first 20 bytes of the hex dump:
45 00 00 22 94 ef 40 00 40 11 a7 d9 7f 00 00 01
7f 00 00 01
- These bytes makeup the IPv4 packet header and the bytes after it makeup the payload.
Differentiated Services Code Point (DSCP)
The second byte in the IPv4 header makes up the Differentiated Services Code Point (DSCP) and Explicit Congestion Notification (ECN) fields. DSCP is related to Quality of Service (QoS) and can be used to prioritize certain network traffic (e.g. Voice over IP (VOIP)). The ECN field is used to indicate when network congestion has occurred in a network.
The value of the second byte in our hex dump is 0x00 which means the value for both the DSCP and ECN fields of our IPv4 header is 0.
Total Length
The 3rd and 4th bytes makeup the Total Length field which will tell us the total length of the IPv4 packet in bytes. The values of these bytes in our hex dump is 00 22, or 0x22. Converted to decimal, this value becomes 34. This means the total length of the entire IPv4 packet (including the header and payload) is 34 bytes. If you scroll back up to the “IPv4 Header” section and count the bytes in the IPv4 packet hex dump, you will see that they add up to a total of 34 bytes.
Identification
The 5th and 6th bytes makeup the Identification field. This field contains a unique number which the receiver can use to reassemble a packet into its proper order if the packet has been split up (fragmented) for transmission. In the case of our hex dump, these bytes have a value of 94 ef, or 0x94EF (38127 in decimal).
Flags and Fragment Offset
Bytes 7 and 8 makeup the Flags and Fragment Offset fields. In our hex dump, their values are 40 00, or 0x40. In binary, that is 01000000. The first 3 bits makeup the Flags field:
- Reserved: 0
- Don’t Fragment (DF): 1
- More Fragment: 0
For this IPv4 packet, only the DF flag is set. The Fragment Offset field has a value of 0.
Time To Live (TTL)
Byte 9 is the Time To Live (TTL) field. In our hex dump, its value is 0x40, or 64 in decimal.
Protocol
Byte 10 is the Protocol field. This field identifies the protocol that’s encapsulated in the payload. The value in the hex dump is 0x11, or 17 in decimal. We can reference this document to see 17 corresponds to UDP, indicating the IPv4 packet contains a UDP datagram.
Checksum
Bytes 11 and 12 comprise the Checksum field which is used by the receiver to confirm no errors occurred during the transmission of the packet. In the hex dump, the value of this field is 0xA7D9.
Source and Destination Address
Bytes 13-16 comprise the IPv4 Source Address field. The bytes in the hex dump are 7f 00 00 01. 0x7F to decimal is 127, so the source IP address is 127.0.0.1. The next 4 bytes are the Destination Address, and the value is the same.
The rest of the hex dump is the IPv4 packet’s payload (in this case, a UDP datagram).
UDP Datagram Header
Removing the IPv4 header, here’s what’s left of the hex dump:
ce 47 15 30 00 0e fe 21 68 65 6c 6c 6f 0a
These bytes comprise a single UDP datagram. We can use this diagram to interpret these bytes:
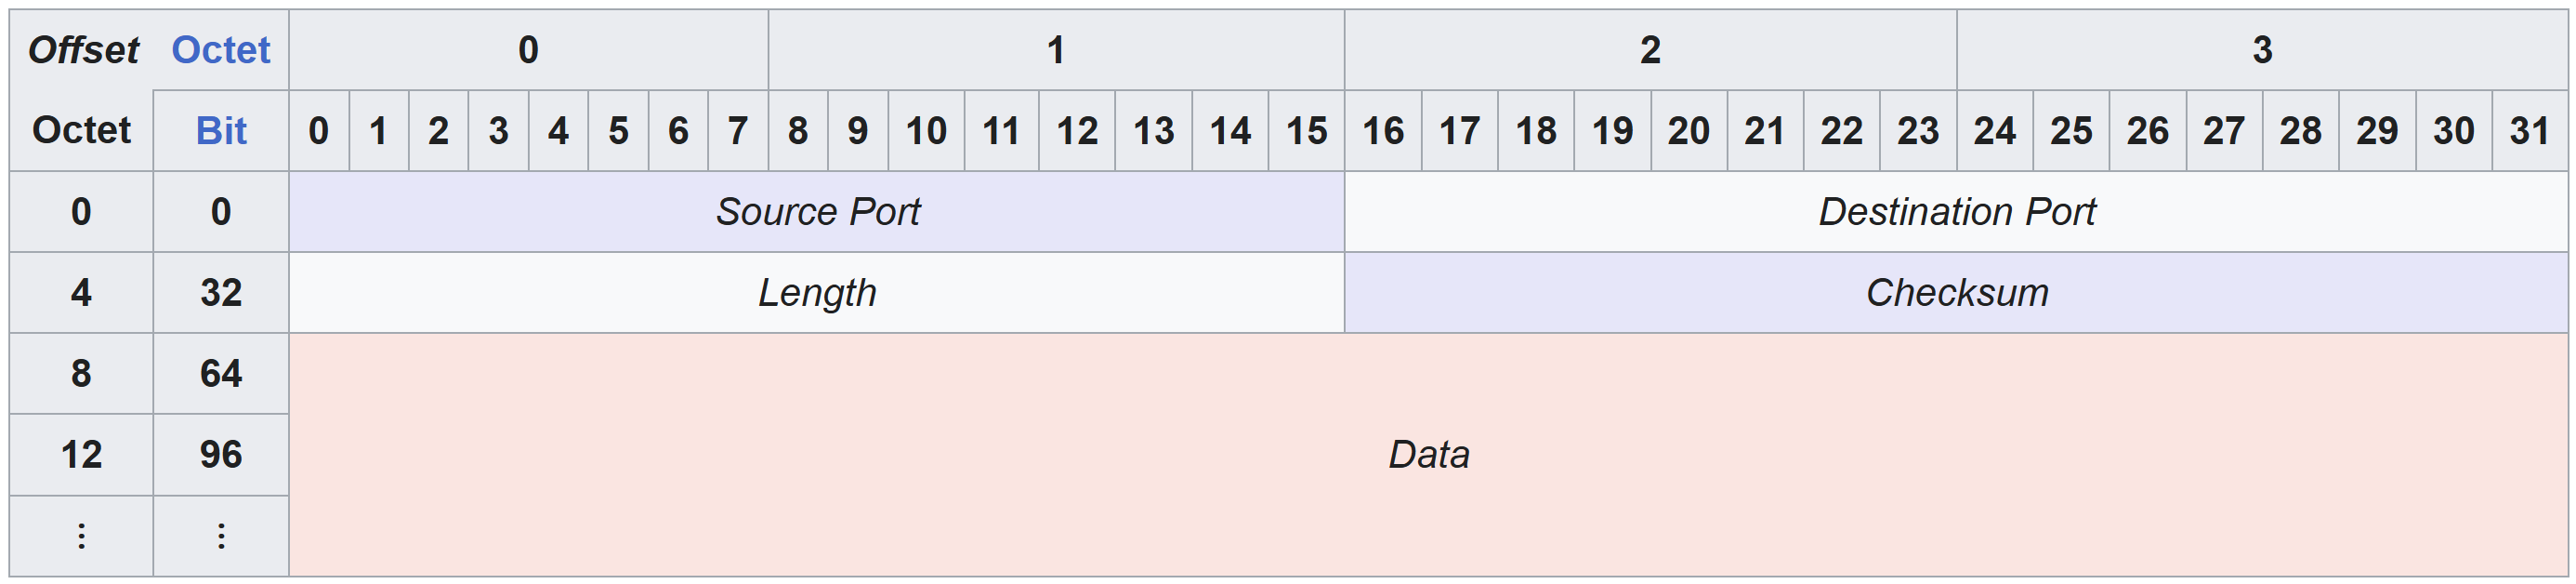
Source Port
The first 2 bytes comprise the source port. In the hex dump these bytes are 0xCE47, or 52807.
Destination Port
Bytes 3 and 4 are the destination port. In the hex dump these bytes are 0x1530 or 5424 in decimal.
Length
Bytes 5 and 6 makeup the Length field. This field tells us the total length of the entire UDP datagram (header and payload) in bytes. In our hex dump, the value of this field is 0x0e, or 14 in decimal. This means the total size of this UDP datagram is 14 bytes in length. If you scroll back up to the “UDP Datagram Header” section and count the bytes, you will see they add up to a total of 14 bytes.
Checksum
Bytes 7 and 8 makeup the Checksum field. We already covered this field in the IPv4 packet header. The value for this field in the UDP datagram header is 0xFE21.
UDP Datagram Payload
The rest of the hex dump is the UDP datagram payload:
68 65 6c 6c 6f 0a
Convert to ASCII:
echo "68656C6C6F" | xxd -r -p
Output:
hello
And that’s it. You have successfully interpreted the raw bytes of an entire captured network packet. I hope you have gained a new appreciation for network forensics tools like Wireshark and tcpdump.